
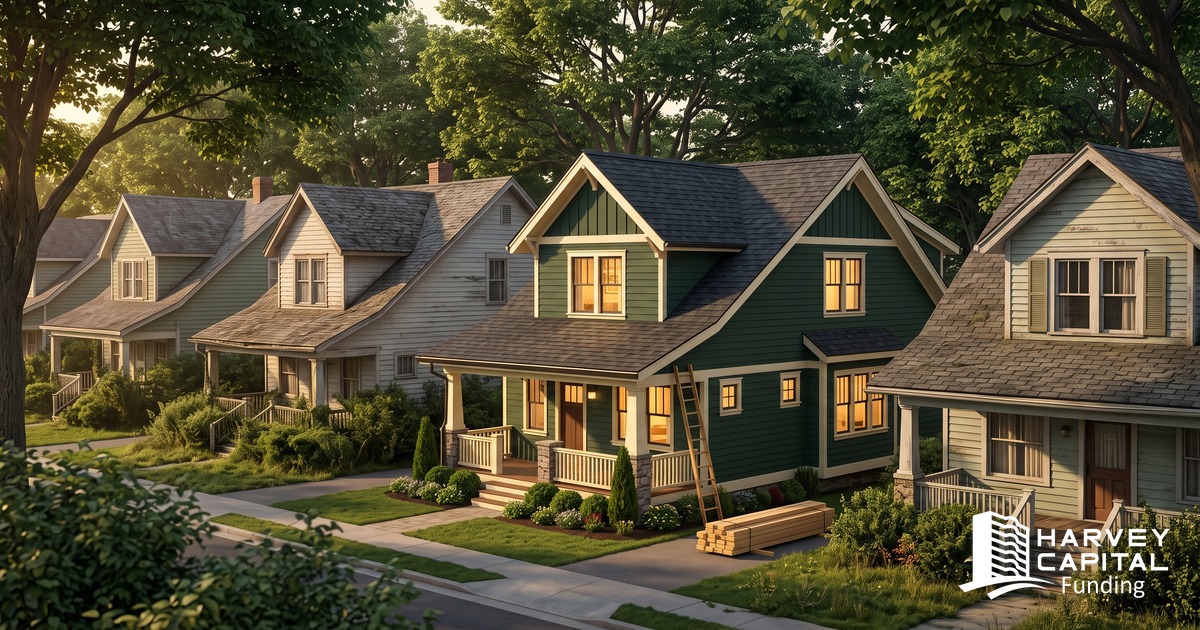
The median owner-occupied home in America is 42 years old. In 1990 it was 25. For anyone who renovates houses for a living, I think that is good news, and it is going to stay good news for a long time.
I first heard a version of this number on a podcast episode about Home Depot, and I had it checked against the Census data before writing about it. The headline held up. Part of the history did not, and the corrected version is below.
How the Country's Houses Got Old
In 1940 the median American home was about 25 years old. Then came the post-war building boom. The country built new houses so fast that the whole housing stock got younger, and by the early 1970s the typical home was only about 22 years old.
That was as young as it got. Building slowed relative to the size of the stock, and the median home has been getting older ever since:
| Year | Median age of an owner-occupied U.S. home |
|---|---|
| 1990 | 25 years |
| 2000 | 29 years |
| 2010 | 33 years |
| 2024 | 42 years |
Today, 48% of all housing units in the country were built before 1980, and only about 4% were built in 2020 or later. Builders completed about 1.6 million homes in 2024 and about 1.5 million in 2025. Against a stock of roughly 147 million units, that adds about 1% a year.
At that pace the old houses are not going anywhere. Most of the homes people will live in ten years from now are already standing, and a lot of them need work.
Virginia Is a Little Younger. Our Book Is Not.
The median home in Virginia is 39 years old, and 42% of the state's homes were built before 1980. The Richmond metro runs slightly younger, at 38 years with 41% built before 1980. The Lynchburg metro runs older, at 43 years with 48% built before 1980.
Our own loan book skews much older than any of those numbers. Every single-family house we have financed since last November, 34 of them, was built before 1978. More than three-quarters were built before 1940. That is where the renovation work is, and it is where the operators we lend to find their deals.
Why Older Houses Are the Business
Older houses cost more to keep up. In 2023, owners of homes built before 1980 spent 24% more on improvements and 76% more on maintenance than owners of homes built since 2010, according to Harvard's Joint Center for Housing Studies.
That cost is exactly why a renovated older house is worth more than an unrenovated one. A buyer paying for a house somebody already brought back is paying to skip the roof, the plumbing, the wiring, and the surprises. A renter choosing between two older units will pick the one that has been done. The operator who does that work well is selling something the market has more demand for every year.
For a flipper, that means a supply of renovation candidates that grows on its own, in neighborhoods with established streets, schools, and comps. For a landlord, it means competing in a rental stock that is aging too. Harvard's researchers put the median age of U.S. rental units at 45 years in 2023, up from 36 in 2003. A well-renovated older rental stands out in that market.
None of that makes every old house a deal. Homeowner remodeling spending is about $517 billion a year right now, and Harvard projects its growth to slow to about half a percent over the next year. An old house with a bad budget is still a bad deal. The operators who win with older homes are the ones who price the old-house items before the offer. We wrote a full guide to that this week: the lead paint rule and the systems behind the walls.
What We Believe
I do not see an aging housing stock as a problem for our industry. I see a country that stopped building fast enough to keep its housing young back in the 1970s, and a growing number of homes that need someone to bring them back. That work is the whole business for the operators we lend to, and there is more of it every year.
If you have an older house under contract, or one you are looking at, call 804-208-0465 or use the Discuss My Deal form. We will look at the numbers with you, old-house items included.
Sources
- Median age by decade: U.S. Census Bureau, 1940 Census of Housing; Annual Housing Survey 1973 and 1980; 1990 Census (CH-2-1); Census 2000 (SF3); American Community Survey 2010 and 2024, tables B25035, B25037, and B25034. Age is the survey year minus the median year built. The 1940 to 1980 figures cover all housing units, and the 1990 to 2024 figures cover owner-occupied homes. Figures before 1990 come from different surveys and are approximate. data.census.gov
- National Association of Home Builders, Eye on Housing (March 2026), on the share of owner-occupied homes built before 1980. eyeonhousing.org
- Housing completions: U.S. Census Bureau, New Residential Construction. census.gov
- Improvement and maintenance spending by home age, and the remodeling spending outlook: Harvard Joint Center for Housing Studies remodeling research and Leading Indicator of Remodeling Activity (July 2026). jchs.harvard.edu
- Rental unit age: Harvard Joint Center for Housing Studies, America's Rental Housing 2026.
- Virginia, Richmond metro, and Lynchburg metro: American Community Survey 2024 1-year estimates, tables B25035 and B25034.
- Harvey Capital Funding loan book: county records of year built for single-family properties financed November 2025 through September 2026.