
Every private loan has a term on the note. Six months is the default most operators pick. Almost nobody measures how long the money actually stays out, or what that time ends up costing once the loan is paid off.
We can, because our loan tape is public. So this month the dataset is our own book.
We took the 21 loans on our published tape that borrowers paid off in 2026, including three we had sold to other investors and kept servicing, since we still saw the payoff come in. One note we sold at par in July is still outstanding, so it is not in the set. For each of the 21 we measured funding date to payoff date. Then we priced every loan at our standard product, 12 percent interest, 3 origination points, and a $995 document fee, so the cost comparison is apples to apples. The actual rates on the tape varied by borrower and by when the loan was written.
How long the money stayed out
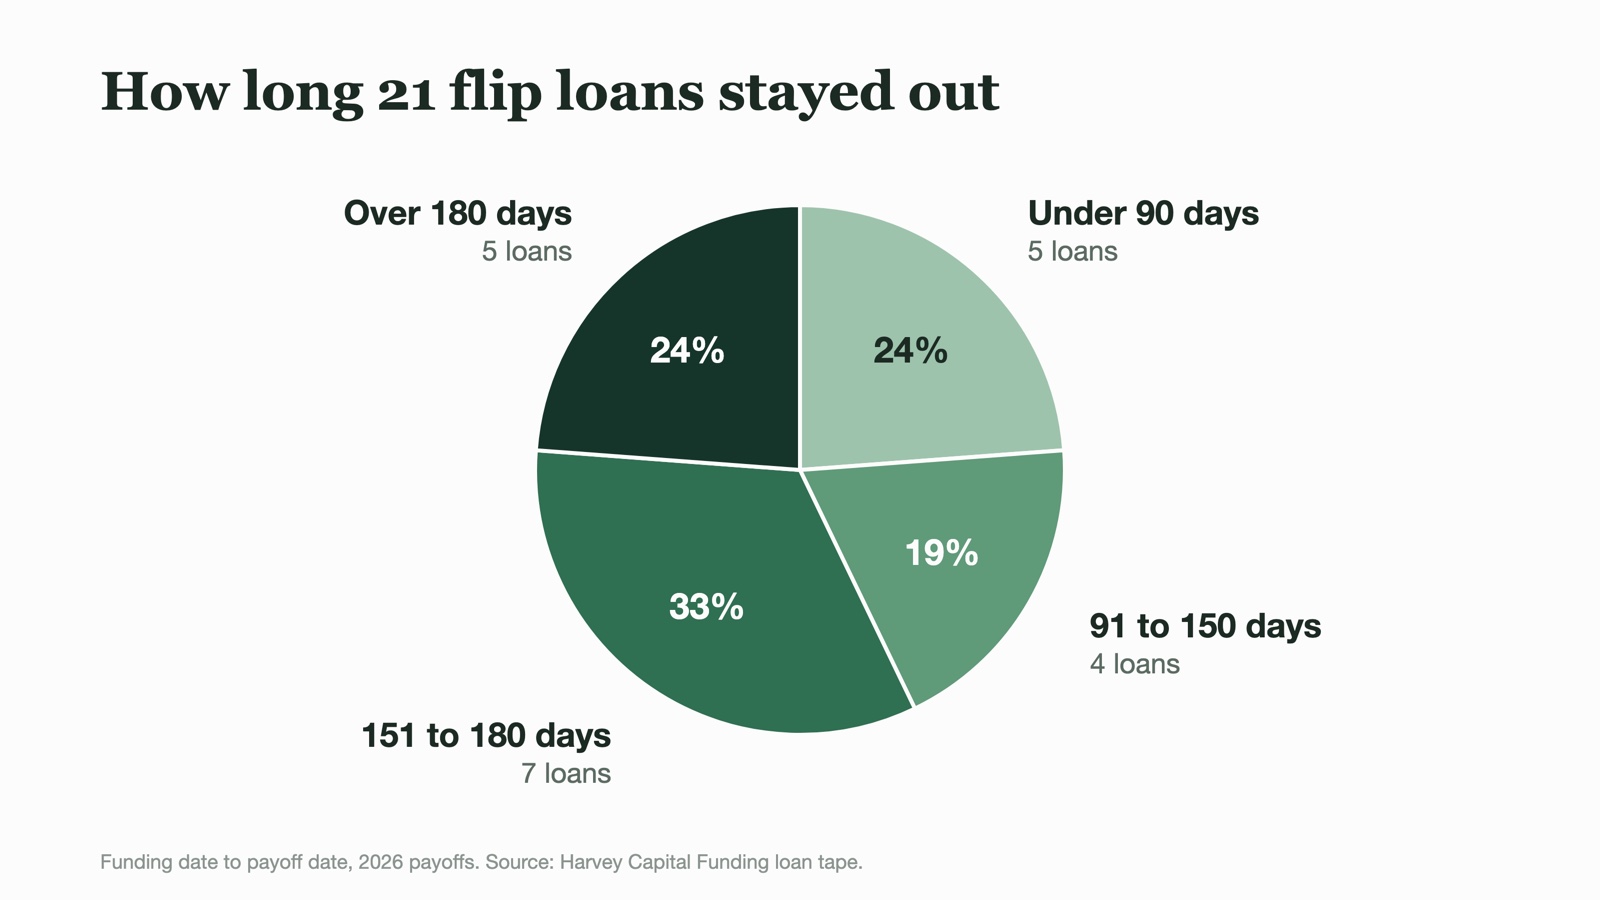
Median hold: 172 days. Just under six months.
- Five of the 21 paid off inside 90 days. The fastest was 46 days.
- Four paid off between 91 and 150 days.
- Seven paid off between 151 and 180 days, right up against a six-month maturity.
- Five went past 180 days. Four of those landed within ten days of the six-month mark, at 184 to 190 days, and the longest ran 214 days.
The distribution has two humps. A quarter of the loans were in and out in under three months. More than half ran to the six-month mark or a little past it. Very little sat in the middle.
What the time cost
All-in cost to the borrower as a percent of the loan amount, by how long the loan was out, at standard pricing:
- Paid off inside 90 days (5 loans): median 5.9 percent of principal.
- 91 to 150 days (4 loans): median 7.8 percent.
- 151 to 180 days (7 loans): median 9.7 percent.
- Past 180 days (5 loans): median 9.8 percent, before any extension points. On a six-month note those five would also owe an extension fee, two points in our case, which would put them near 11.8 percent.
Across all 21, the median loan cost 9.4 percent of principal to carry from funding to payoff. In dollars: $2.79 million of principal went out, and the cost to use it comes to $245,000, about 8.8 percent on a dollar-weighted basis.
Put another way, on a $150,000 loan the operator who finished in 90 days paid roughly $10,000. The operator who needed the full six months paid roughly $14,500. Same house, same lender, same rate sheet. The $4,500 difference is three months of interest.
Per month held, the fast loans cost far more, about 3.6 percent of principal per month against 1.7 percent for the long ones, because the points and the document fee are paid once, and a 46-day loan spreads them over a month and a half. Short holds cost the most per month and the least in total. Over six months the points fade into the background and the interest is the whole story, so on a long hold the rate matters more than the points, and on a short hold it is the other way around.
Henrico permits: a read on activity
Building permits are the cleanest public proxy for how much work is actually happening in a county. Henrico is the only jurisdiction in the metro that publishes a monthly permit file, so here are five months of it, residential only:
- April: 299 residential permits, 126 new builds, 44 renovation permits over $25,000.
- May: 265 residential, 88 new builds, 47 renovation permits over $25,000.
- June: 265 residential, 91 new builds, 56 renovation permits over $25,000.
- July: 246 residential, 112 new builds, 49 renovation permits over $25,000.
- August: 257 residential, 84 new builds, 49 renovation permits over $25,000.
The read: steady, not surging, not falling. After April, residential permits have held in a band of 246 to 265 a month. Renovation permits over $25,000, the number closest to flip and rental-rehab activity, have run 44 to 56 a month with $5 to $7 million in declared value each month. New builds swing more, from 84 to 126, without a trend.
One caution on the headline number. Henrico's August total was $709 million in declared valuation, and roughly $600 million of that is three commercial shell-building permits at White Oak Technology Park in Sandston. Strip those out and August was an ordinary month: $19 million of residential value. If you see the $709 million figure quoted as a housing boom, it is not.
Source: Henrico County Open Data, monthly building permit reports, April through August 2026. Richmond city, Chesterfield, and Hanover still do not publish a comparable monthly file. We are working on it.
This piece is Issue #5 of the Central VA Real Estate Insider, our monthly Substack for operators. Past issues are collected at harveycapitalfunding.com/insights.